How big a part will visual content play in your marketing strategy throughout 2019? Want to know how marketers are utilizing visual content for their online campaigns?
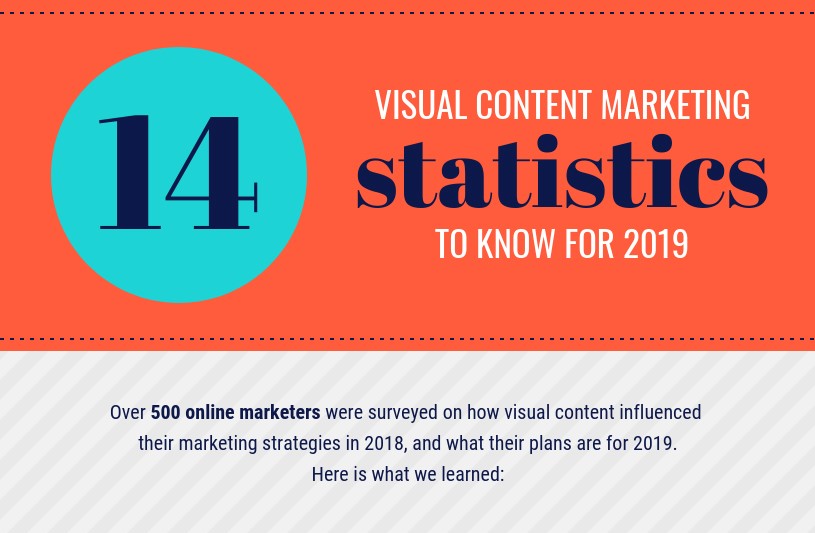
Venngage shares the stats you need to know in this infographic.
The stats shown are from their recent survey of online marketers, in which they asked the following questions:
1. How did the use of visual content in marketing change from 2017 to 2018?
2. What type of visual content was used more frequently in 2018?
3. What types of visual content engaged audiences best in 2018?
4. How much time did marketers spend on average creating visual content in 2018?
5. How did marketers create their visual content in 2018?
6. What was the biggest struggle when it came to producing engaging visual content?
7. What percentage of their marketing budget was spent on producing visual content?
8. How much do marketers project to spend on producing visual content in 2019?
9. How difficult is it for marketers to consistently product visuals for their brands?
10. What part of creating visual content do marketers wish could be automated?
11. How essential was visual content to B2B and B2C marketing strategies in 2018?
12. What percentage of marketers rely on blogging as part of their strategy?
13. What percentage of those blog posts contained some type of visual content?
14. What percentage of businesses will rely heavily on visual content for marketing in 2019 and 2020, according to marketers?
Check out the infographic for more detail.

=========================================================
Thanks for reading this post! Don’t just read and leave,
please like, follow me, and share with others too!!…
=========================================================
This article was originally published in 9 January 2019. It was most recently updated in November 24, 2022 by