Black Friday is here again! Every year, the day after Thanksgiving marks the beginning of the holiday shopping season.
Cheap Sally shares some of the stats and history of the biggest shopping festival in this infographic. Remember to visit our website for our special Deals.
They shared the following:
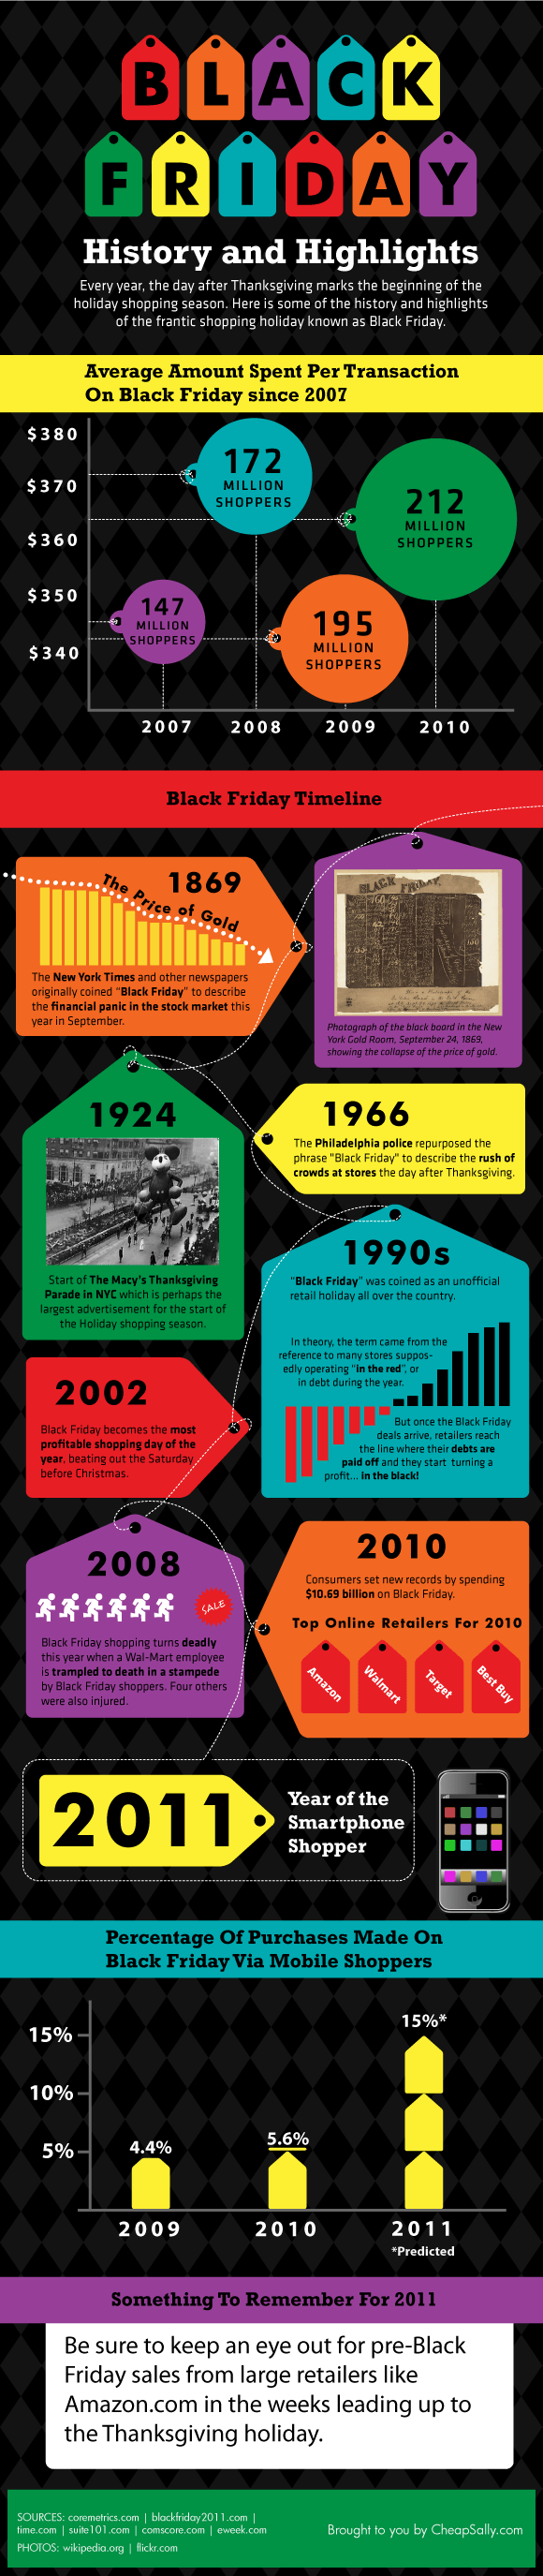
1. The Average Amount Spent Per Transaction on Black Friday since 2007
2. Black Friday Timeline and;
3. Percentage of Purchase Made on Black Friday via Mobile Shoppers.
Check out their infographic for more detail.
=========================================================
Thanks for reading this post! Don’t just read and leave,
please like, follow me, and share with others too!!…
=========================================================
This article was originally published in 21 November 2018. It was most recently updated in November 24, 2022 by